The Most In-depth Reporting Available
Over the past 20 years, PbS has uniquely created uniform data definitions, outcome measures and a quality assurance process that creates the most timely, comprehensive and accurate database of its kind and allows for extensive reporting capabilities. PbS reports include:
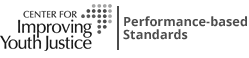
Outcome Measure Graphs
The graph below is generated for every outcome measure. The blue bars represent how the site has performed for each data collection period. The red dotted line represents the national field average, which allows the user to compare the site to the field. Each graph is accompanied by a description of where the data was collected from and a table containing the numerical information represented by the colored bars. Correction, detention and assessment participants also have the ability to compare themselves to more specific national field averages including sites of similar type, size or population gender.
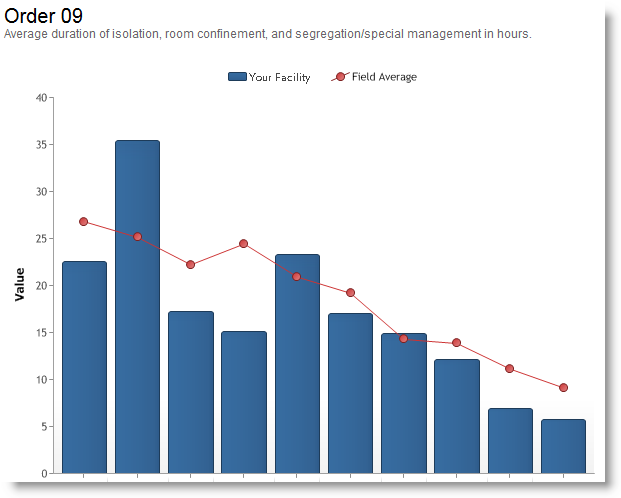
Response Summaries
Summary reports, available to all participants, display the number of responses for each question on the data collection forms.
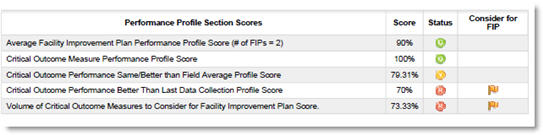
Detailed Analysis Reporting
PbS provides an in-depth overview of how a site is performing by analyzing each site’s definitional compliance, sample size, improvement planning and performance related to outcome measures. These reports use color coding and flagging systems to indicate the participant’s performance and highlight areas that participants may want to consider for improvement.
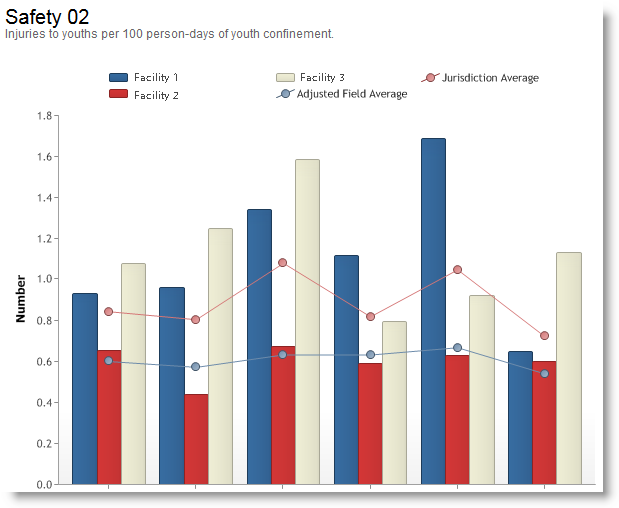
Agencywide Reports/Agency Summaries
The agencywide report is an expanded version of our outcome measure graphs for agencies with more than one participating site of the same type. Using this report, an agency with three sites could review all three sites’ outcomes over time on a single graph, as pictured below. The agencywide report includes an agency outcome average in addition to the PbS national field average, adding another level of comparison. Like our single outcome measure graphs, these agencywide reports also feature a table containing the numerical information represented by the colored bars.
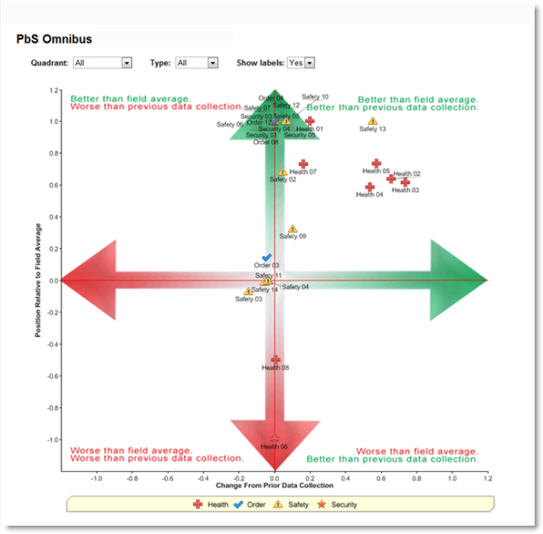
Omnibus Report
The PbS Omnibus Report is unlike any other in juvenile justice. Available for correction, detention and assessment sites, the Omnibus Report uses a four quadrant system to measure performance in relation to the national field average and to prior performance in the same one-page report. Participants can view information by outcome measure to determine which areas of operation may require improvement. In addition to viewing information for a single site, organization directors can view aggregate information for all sites in their agency and get a birds-eye view of how each site is performing and improving.